Environment for creative processing of text and numerical data

SURVO MM
Home  |  News  |  Publications  |  Download  |  Flash

Survo Graphics Gallery

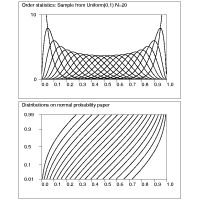
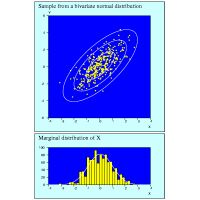
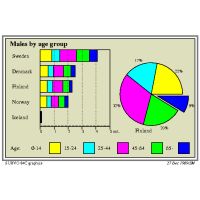
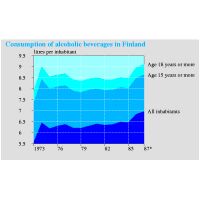
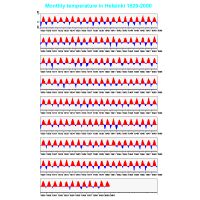
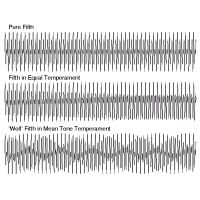
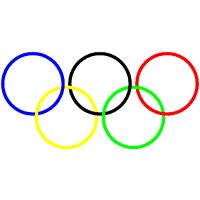
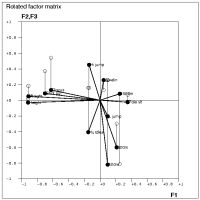
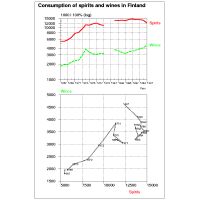
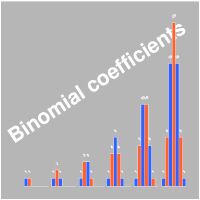
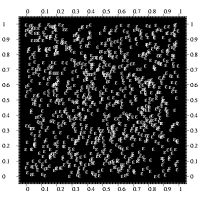
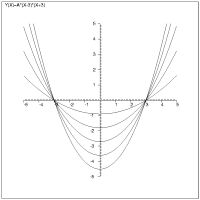
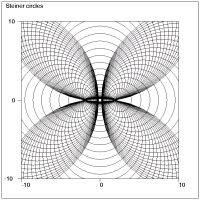
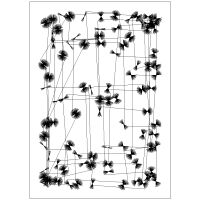
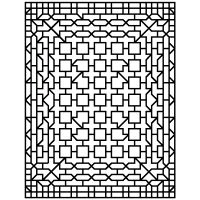
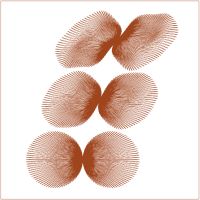
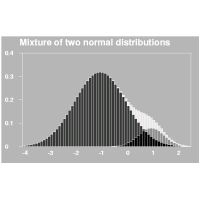
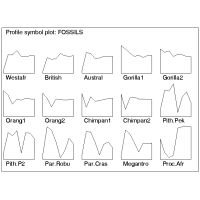
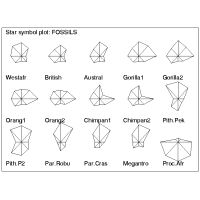
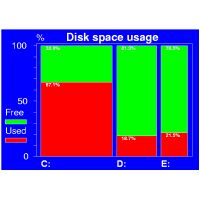
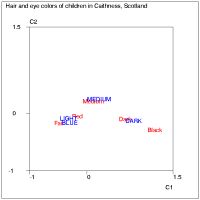
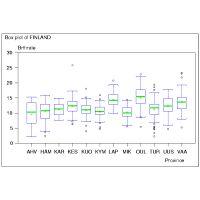
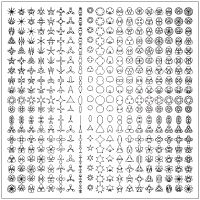
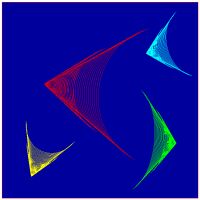
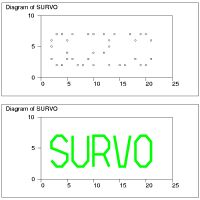
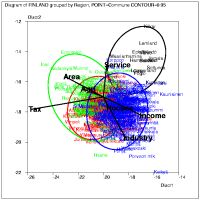
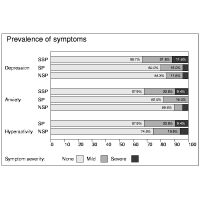
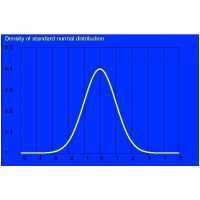
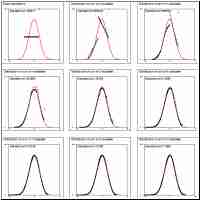
The gallery presents a large collection of Survo graphs with their work schemes. Hence, in addition to looking at the graphs, it is possible to see how they are actually created in Survo. The gallery also includes a few graphs that may look a bit complicated. However, there is no need to be afraid of them, as the following quote explains:

Survo has a picturial language of its own. This language is based on certain basic types of graphs. The picturial language permits free combinations and overlays of basic graph types. Each graphical component can be enhanced and decorated by colors and other graphical and textual attributes in many ways. This approach enables making of very complicated pictures. Many people - seeing the final result only - are afraid that this must be a difficult task. Let's however pretend that there are no complicated things. If something looks complicated, it is merely combination of simple things. Of course, some skills are needed in order to reverse the process and see in each case what are those simple components forming the final picture. In order to learn such skills it is helpful to study ready-made pictures and compare them to the corresponding Survo plotting schemes (PLOT operations with various specifications). It is also worthwhile to make various experiments by modifying existing plotting schemes - even by trial and error.

S.Mustonen (1996): Survo ja minä (Survo and I), p. 173

Index and catalog

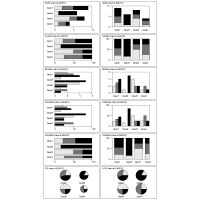
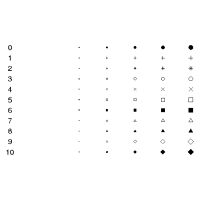
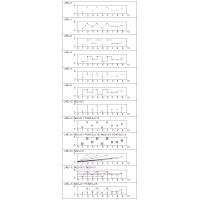
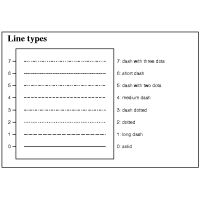
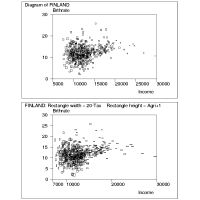
The graphs in the gallery may be browsed in a free order. Following the links of the graph pages eventually takes the whole tour through the gallery. The index is sorted according to the graph type. You may also take a look at the gallery by browsing the catalog below, which includes the thumbnails of all graphs. They are also links to the corresponding pages, where you can find how the graphs are made.

Histogram of mean temperature in July, Helsinki 1844-1978 Normal probability plot of rainfall in Helsinki Bar chart of private gross fixed capital formation Bar chart of Finnish books published in 1983-1988 Time series diagram of mean temperature in July, Helsinki 1844-1978 Normal distribution as a limit of t distributions Scatter plot of simulated data with contour ellipses and a trend line Pie charts demonstrating Survo PostScript shadings Sample from a uniform distribution Random sample from a bivariate normal distribution Bar chart and a pie chart of males by age group in Nordic countries Generalized scatter plot of towns and communes in Finland Time series diagram of consumption of alcoholic beverages in Finland Time series of monthly temperature in Helsinki 1829-2000 Musical intervals in different temperaments (curve plotting) Olympic rings (curve plotting, parameters depend on data) Contour plot, front cover of the Survo User Guide (1992) Matrix plot of consumption of various beverages in 12 European countries Draftsman's display (scatter plot matrix) of largest Finnish towns and communes Dissonance function for accuracies c=2,3,4,5 Rotated factor matrix as a scatter plot Time series diagrams of consumption of spirits and wines in Finland 1967-1991 Plotting a matrix file of binomial coefficients as a multiple bar chart 999 random points as a scatter plot Plotting curves with the coordinate axes relocated Plotting curves and combining pictures Curve plotting (Steiner circles) Placing and rotating text Thing Carpet Thing 2 Mixture of two normal distributions Discriminant space of three iris species with contour ellipses Multivariate diagrams; Chernoff's faces Multivariate diagrams; Andrews' function plots Multivariate diagrams; Andrews' function plots in polar coordinates Multivariate diagrams; profile symbol plot Multivariate diagrams; star symbol plot Bar chart of disk space usage Correspondence analysis diagram (Fisher's example 1940) Box plot of birthrate in Finnish provinces Origin of species Spiral From circle to square Influence curves for the correlation coefficient 2-dimensional projections of a 4-dimensional cube Multiple correspondence analysis of Finland Grouped scatterplot matrix of the Iris data Four fish in an aquarium Measurement model and measurement scale Plotting and filling polylines Picture writing Mixture of two normal distributions Diagram of hierarchical cluster analysis (dendrogram) Division of the plotting area into different regions Bar and pie chart types Marker types Connecting points with lines in various ways Line types Enhanced scatter plot of Finnish communes Proof of the Pythagoras' theorem Chord figure Matrix plot of Finnish towns and communes Pie chart of population in Nordic countries Connecting points with lines Mean temperature and rainfall on probit scale Mixture of bivariate normal distributions Graph paper and contour ellipses Discriminant analysis of Finland Bar chart of several groups Density of standard normal distribution Central limit theorem Mean-deviation plots

Imagination

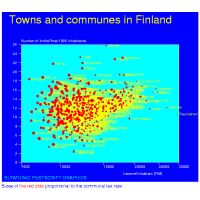
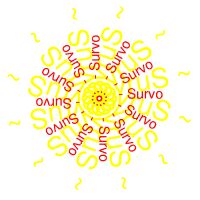
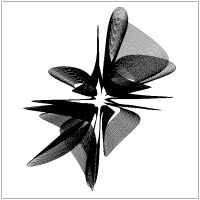
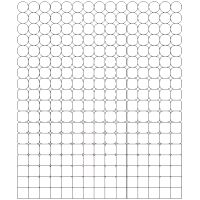
The above selection of graphs is not in any case a perfect representation of the graphical possibilities in Survo. The basic graph types may be mixed freely, each detail be adjusted sharply, and the graphs may be created as combinations of arbitrary many pictures. It means that the imagination of the user is the only thing that might set any limits for the kind of graphs that can be plotted in Survo.

Home  |  News  |  Publications  |  Download  |  Flash
Copyright © Survo Systems 2001-2008. All rights reserved.
Updated 2008-10-20 by webmaster'at'survo.fi.
Best viewed with any browser.