Environment for creative processing of text and numerical data |  |
Environment for creative processing of text and numerical data | |
S.Mustonen (2002)
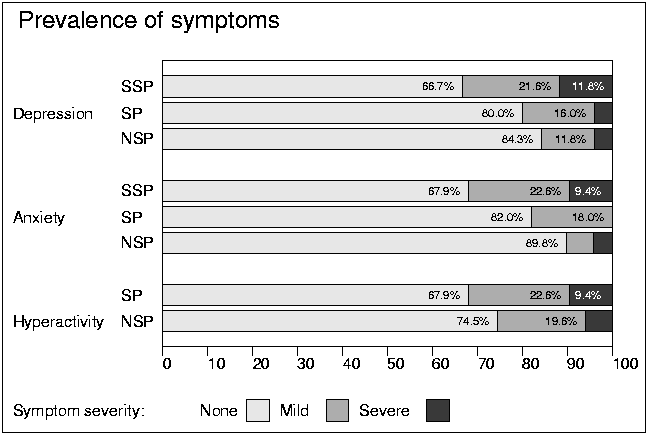
1 * 2 *DATA DAH 3 *Diagnosis Symptom None Mild Severe 4 *Depression SSP 34 11 6 5 *Depression SP 40 8 2 6 *Depression NSP 43 6 2 7 *Anxiety SSP 36 12 5 8 *Anxiety SP 41 9 0 9 *Anxiety NSP 44 3 2 10 *Hyperactivity SP 36 12 5 11 *Hyperactivity NSP 38 10 3 12 * 13 *GROUPING=Diagnosis /This is a new option since ver.1.28!14 * 15 *PLOT DAH/ Plot the graph (also GPLOT is possible) 16 */PS-PDF DAH.PS/ Display the graph with Adobe Acrobat 17 *TYPE=%HBAR / Type of the graph 18 *DEVICE=PS,DAH.PS / PostScript file is saved as DAH.PS 19 *HEADER=[Swiss(15)],Prevalence_of_symptoms / Header of the graph 20 *SCALE=0(10)100 / Define the numerical scale 21 *XDIV=25,70,5 / Divide the plot area (space for the group name) 22 *SHADING=0,2,6 / Shadings of the bars 23 *LEGEND=Symptom_severity: / Legend of the shadings 24 *VALUES=[autom_color(0.4)][Swiss(7)],##.#%,-0.5 25 * / Percentage values in the bars 26 *VALUEMIN=8 / Smallest value that is written in the bars 27 *PEN=[autom_color(0)][Swiss(10)] / Default font and size 28 *SIZE=1420,950 / Size of the graph 29 *GAP=0.2,0.7,0.7 / Gaps between the bars, see GAP? 30 * 31 *The autom_color option controls the color of the text to be written, 32 *depending on the color of the background. 33 *
Index | Catalog | Previous | Next