Environment for creative processing of text and numerical data |  |
Environment for creative processing of text and numerical data | |
S.Mustonen, Survo Users' Guide (1992), p. 294
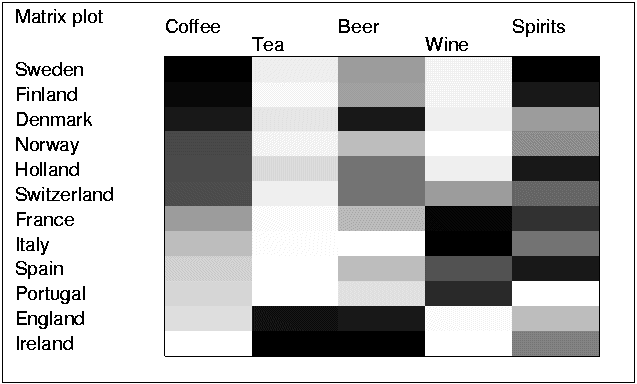
1 * 2 *DATA COUNTRIES A,B,N 3 *Consumption of various beverages in 12 European countries 4 * 5 N Country Coffee Tea Beer Wine Spirits 6 A Sweden 12.9 0.30 58.3 7.9 2.9 7 * Finland 12.5 0.15 54.7 7.6 2.7 8 * Denmark 11.8 0.41 113.9 10.4 1.7 9 * Norway 9.4 0.19 43.5 3.1 1.8 10 * Holland 9.2 0.58 75.5 9.7 2.7 11 * Switzerland 9.1 0.25 73.5 44.9 2.1 12 * France 5.2 0.10 44.5 104.3 2.5 13 * Italy 3.6 0.06 13.6 106.6 2.0 14 * Spain 2.5 0.03 43.6 73.2 2.7 15 * Portugal 2.2 0.03 27.5 89.3 0.9 16 * England 1.8 3.49 113.7 5.1 1.4 17 B Ireland 0.2 3.73 124.5 3.8 1.9 18 * 11.1 19 *-SORT A,B,CUR-120 * 21 *PLOT COUNTRIES/ TYPE=MATRIX SCREEN=NEG DEVICE=PS,EX.PS 22 *SIZE=1164,700 XDIV=300,800,64 YDIV=50,550,100 23 *COLUMNLABELS=1,2 24 *
Index | Catalog | Previous | Next